iCODE
Interactive Curry Observation DEbugger (iCODE) is a tool to support programmers stepping on the lazy evaluation order of expressions at the source code level. Every executed expression is covered in a layout of the source code and its runtime value can be represented to the user.
Installation
To run iCODE, you need the Curry development environment PAKCS.
After installing PAKCS, you should download iCODE and follow the installation instructions:
 1. GO to the directory containing your files.
 2. Type: make
 3. Run iCODE by the command: icode <file name> <expression>
                         e.g. icode Test "reverse [1,2,3]"
    If you want only to see the executed parts of the program without running the debugger,
    you can write this command: cutter <file name> <expression> <selected functions>
                           e.g. cutter Test main "reverse main"
Starting
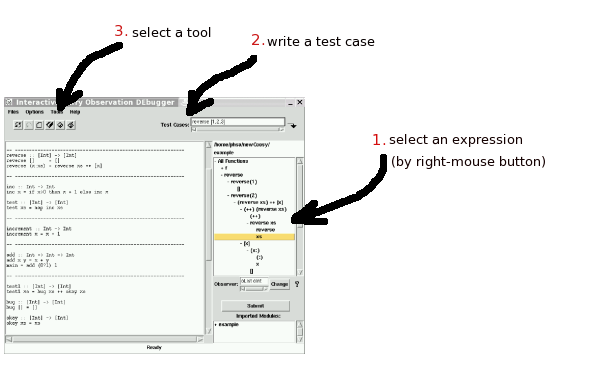
After running iCODE, the source code and a tree representation of the whole program expressions are displayd in a graphical user interface (Browser). Follow the three steps represented in the image.
Tools
You have access to three different sub-tools:
- CUrry TesTER (CUTTER)
- Curry Object Observation Interactive SYstem (COOiSY)
- Curry trACEr (C-Ace)
CUTTER
This tool covers executed parts of the program by highlighting executed expressions with two methods:
- Covering function definitions in the original source code.
- Covering program expressions in a tree representation of the program.
Switching between the above methods is possible by selecting an option in the Browser.

The tool also represents the number of function calls to help the user locating a non-terminating computation.
Example (Non-Terminating Computation)
As an example, we consider the Fibonacci sequence that can be produced by the following simple function in a program:
 fib n
   | n==0      = 1
   | otherwise = n * fib n
It supposed that the program has a failure. In the second Guard, we have written fib n instead of fib (n-1). Executing the program on a number (larger than zero) generates a non-terminating computation.
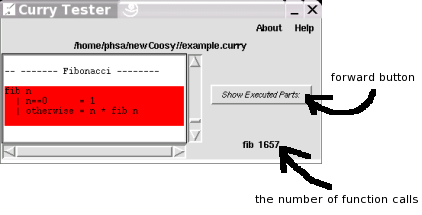
To test the program, we select fib as a single unit and activate CUTTER in the browser . The test case is supposed to be fib 10 .The result is represented in the viewer by pressing the forward button. It shows that the function fib is executed 1657 times while the program execution is not yet completed. Every time we press the forward button, the number of function calls increased. There is a nonterminated computation in the program.
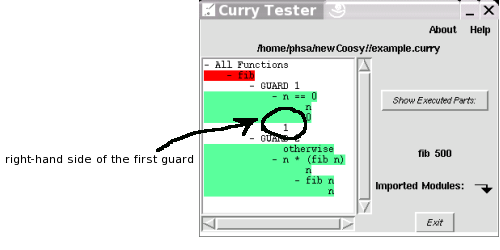
Now we select the appropriate option to see the executed subexpressions of the program in a tree representation. The following figure displays the executed expressions of the selected unit. The last executed expression (in this step) is highlighted red and other ones green.
As we see, the right-hand side of the first Guard is not executed and only the second Guard is highlighted completely. That means, the loop is generated by the second Guard.
COOiSY
Using this tool, the user can see how the evaluation of selected expressions proceeds. Every runtime value of selected expressions is represented with a textual visualisation, which could be:
- _ : non-evaluated argument
- ! : evaluated argument / undefined result
- ? : logical variable
- ?/v : logical variable bound to value v
- {\LHS→RHS} : Functional value
- value
Example (No Results)
Consider the following faulty program:
 maxList :: [Int] -> Int
 maxList = foldl max 0
    where
          max :: Int -> Int -> Int
          max x y  | x > y = x
                   | x < y = y
The program is written to compute the largest element in a given list. The program returns No more solutions when the test case is maxList [2,1,2], because there is no Guards for equal numbers in max.
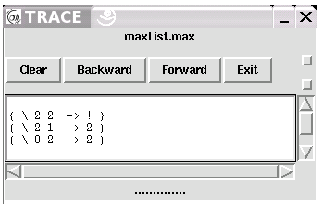
To see the behavior of the function max, we should select max as a single expression and activate COOiSY. The runtime values of max is represented in the following figure.
The function max is called three times. In the third function call {\2 2 → !}, it takes 2 and 2 as the inputs and returns ! as the result. The exclamation mark represents that the evaluation is started but not completed. max returns true results for every given list, if we correct for example the first Guard to x >= y = x.
C-Ace
The run-time tracer is implemented as a combination of the two above sub-tools CUTTER and COOiSY.The tool allows the user following the order of evaluations in selected units, with two methods:
- Following the evaluation order of function definitions in the original source code.
- Following the evaluation order of all right-hand side subexpressions in a tree representation of the program.
Example (Unexpected Result)
As an example we consider the following program. The program is written to compute the reverse of two combined lists. For example by giving two lists [1,2] and [3,4], the program should generate [4,3,2,1] as the result.
 reverse :: [Int] -> [Int]
 reverse []     = []
 reverse (x:xs) = reverse xs ++ [x]
 append :: [Int] -> [Int] -> [Int]
 append xs ys = reverse ys ++ reverse ys
Suppose that we have written an incorrect variable in the program. The second call of the function reverse in the right-hand side of append is applicated on ys instead of xs. Generating the test case append [1] [2] offers as unexpected result [2,2]. To locate the failure we select reverse and append as two units and activate Run-Time Tracer.
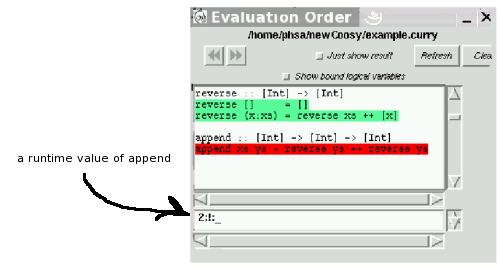
The following figure displays an intermediate step of the evaluations. The figure shows that the function append is being executed and offers a list of numbers as the result. The first element of the list is 2 and the evaluation of the second element is started which is shown by an exclamation mark.
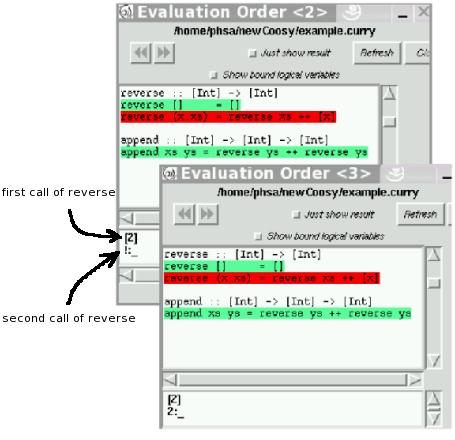
The computation of the second list element needs a function call on reverse. The following figure represents two sequence steps of the evaluations when the function reverse is being executed. In viewer <2>: The first application of reverse has offered a list with one element ([2]) and in the second call of this function, the evaluation of the first list element is started (!:_). In viewer <3>: After completing the execution of the first element, it is evaluated to 2.
The bug is located. The second call of the function reverse should be an application on the given list ([1]), but it is applicated on a list with 2 as an element.
Stepper
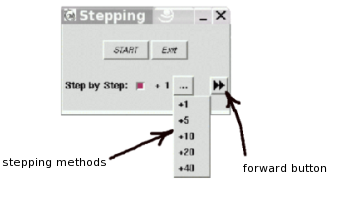
Activating COOiSY or Run-Time Tracer opens a small stepper window. You should select one of the stepping methods and press the forward button to see the evaluation order of program expressions in the viewer.
